
EMEA ETF market trend highlights:
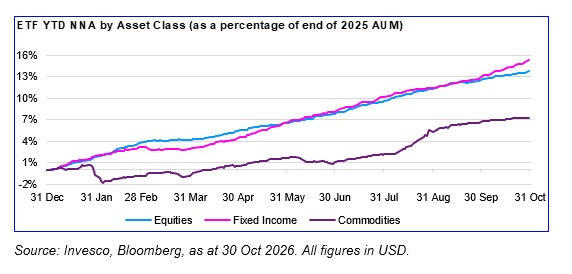
- October brought $44bn of NNA, up from $42bn in September, marking the seventh straight month above $40bn. Year-to-date NNA of $433bn is already well ahead of 2025's record with two months remaining.
- Fixed income flows accelerated from $9bn in September to $15bn. Investors sought safe havens amid equity volatility and AI-related concerns, with the highest NNA in US Treasury, EUR Cash Management and US corporate credit ETFs.
- NNA in equity ETFs remained strong at $28bn, despite volatility in the tech sector. $13bn went into global equity ETFs. US equity flows slowed on AI fears, while European equity flows continued to gain momentum.
- Gold ETCs continued to dominate commodity flows with $1.8bn of NNA. Flows into gold slowed in October in line with a retreat in the gold price.
This month's edition highlights two topics:
- Equity concentration risk: October’s risk-off moves highlighted the high concentration in some market cap-weighted benchmarks (consider our range of equal weight ETFs).
- The yield cushion in bonds: while bonds are offering meaningful income, stretching duration might not be the best strategy as the yield cushion is greater at the short end of the curve (consider our shorter-dated government bond ETFs).
Equities: When concentration isn’t the best idea
The risk-off moves in the market in October made it abundantly clear just how much concentration risk investors are exposed to in certain well-known market cap-weighted indices. The market cap-weighted S&P 500 and MSCI World indices were down by 0.9% and 0.8% respectively in October, while equal-weighted versions returned 5% and 2% over the same period.
2026 has seen the appetite for equal weight ETFs recover, with $8.3bn of inflows YTD including $0.5bn added in October. Invesco is one of the leading providers with the widest offering of equal weight ETFs covering S&P 500, Nasdaq-100, MSCI World, MSCI Europe and EURO STOXX 50.
Bonds: The income cushion is uneven
Bonds are offering something that’s been missing for many years: income. But stretching duration might not be the best course of action. While yields eased a little at the end of October, worsening Middle East tensions could put upward pressure on inflation and, therefore, on yields. In this scenario, the income on offer creates a yield cushion. However, that cushion is greatest at the shorter end of the curve. Short-dated US IG credit would need yields to rise by nearly 300bps over the next 12 months to see a loss, compare to a yield rise of ~35bps for 30y US Treasuries.
Our ETFs offer several options for investors looking to step out of cash following the back-up in yields, while remaining cautious on duration risk. These include our range of shorter-dated government bond ETFs focused on maturities of up to 5 years. This approach could limit the downside risk if yields rise further, while potentially outperforming cash if bond markets rally.
ETF flow highlights in numbers
- European ETFs gathered US$44bn in October, up from US$42bn in September and marking the seventh consecutive month with inflows above US$40bn. Year-to-date NNA reached US$433bn, already ahead of 2025’s record with two months of the year remaining.
- Equity ETFs attracted US$28bn, including US$7.4bn into All-World equity, US$5.9bn into developed equity and US$4.8bn into US equity exposures. European equity ETFs added a further US$2.4bn.
- Fixed income flows accelerated significantly, rising from US$9.1bn in September to US$15bn in October. US Treasury ETFs attracted US$3.6bn, EUR Cash Management US$2.3bn and US corporate credit US$1.7bn.
- Commodity ETFs gathered US$1bn, with gold ETCs attracting US$1.8bn despite a slowing in demand as the gold price retreated during October.
Explore the latest ETF Snapshot
Investment Risks
For complete information on risks, refer to the legal documents. The value of investments, and any income from them, will fluctuate. This may partly be the result of changes in exchange rates. Investors may not get back the full amount invested.
Important Information
Data for all sources – Invesco, Bloomberg, as at 30 October 2026, unless otherwise stated.
This is marketing material and not financial advice. It is not intended as a recommendation to buy or sell any particular asset class, security or strategy. Regulatory requirements that require impartiality of investment/investment strategy recommendations are therefore not applicable nor are any prohibitions to trade before publication.
Views and opinions are based on current market conditions and are subject to change.
For information on our funds and the relevant risks, refer to the Key Information Documents/Key Investor Information Documents (local languages) and Prospectus (English) and the financial reports, available from www.invesco.eu. A summary of investor rights is available in English from www.invescomanagementcompany.ie. The management company may terminate marketing arrangements.
UCITS ETF’s units / shares purchased on the secondary market cannot usually be sold directly back to UCITS ETF. Investors must buy and sell units / shares on a secondary market with the assistance of an intermediary (e.g. a stockbroker) and may incur fees for doing so. In addition, investors may pay more than the current net asset value when buying units / shares and may receive less than the current net asset value when selling them.
For the full objectives and investment policy please consult the current prospectus.
Issued by:
Invesco Management S.A., President Building, 37A Avenue JF Kennedy, L-1855 Luxembourg, regulated by the Commission de Surveillance du Secteur Financier, Luxembourg.
EMEA 6095198/2026