
Why high-yield bonds are an alternative to equity investments
Carl ‘Pepper’ Whitbeck Global Head of High Yield and US Active Fixed Income at AXA Investment Managers
As investors, we are often liable for thinking in specific asset class buckets rather than taking a broader view of the investment universe. Yet, taking that cross-asset class view can allow for some smarter investment choices and allocations.
Let’s take high-yield bonds and US equities for example: While there are many similarities in their characteristics, there are clearly differences, too – the main one being the asset class distinction. And within the investment world, asset class buckets tend to be inflexible.
But when looking at risk-return characteristics, high-yield bonds and equities are more similar than most imagine and could be viewed as competing asset classes. So much so, that we would argue that high-yield bonds should be considered as an alternative to equities, but with lower volatility.
US high yield versus US equities: Volatility is the differentiator
In 2019 US high yield returned 14.41%.[1] In comparison, the S&P 500 returned 31.48% over the same period.[2] However, if you look at a longer time horizon, US high-yield bonds have largely kept pace with equities while having lower drawdowns during periods of volatility. For instance, during the financial crisis of 2007/8, the maximum drawdown of the US high-yield index ICE BofA ML High Yield Index was -33.23% compared to -50.95% for the S&P 500.[3]
Although US equities outperformed the high-yield market in 2019, over the past 20 years US high yield outperformed the S&P 500 (7.01% vs 6.33% annualised). And while the correlation between high yield and equities is historically high (0.65 over the last 20 years), there are significant differences in the underlying volatility of the two – making US high yield markedly less volatile at 8.96 compared to equities at 14.53.[4]
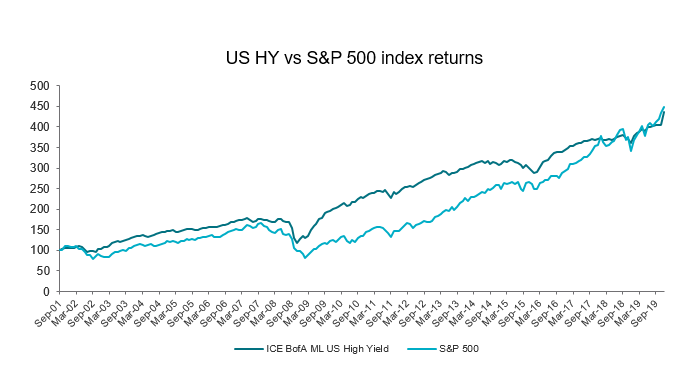
Graph 1: ICE BofA US High Yield index vs S&P 500. Source: Bloomberg as of 31 December 2019. For illustrative purposes only. Past performance is not indicative of future results. For illustrative purposes only.
In order to generate returns on equities, you need earnings growth or multiple expansion. However, as an investor in high yield, your return is more reliable as it comes from your coupon payment. And default rates are nowhere near their 2009 peak of 12.1% or their 2016 high of 4.3%.[5] Estimates for 2019 are at 2.9%, with an increase to 3.0% in 2020 (as Graph 2 shows) – both of which remain below the long-term average of 3.4%.
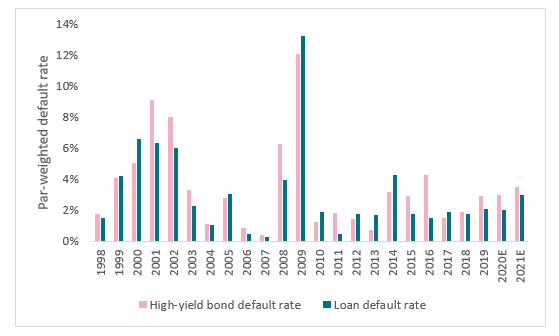
Graph 2: Source: J.P. Morgan, Default Monitor, 2 January 2019. High-yield bonds long-term default rate since 1997, leveraged loans long-term default rate since 1998.
US election, Brexit and economic uncertainty
Looking into 2020, there are plenty of reasons to expect further uncertainty. For one, the 2020 US presidential election is likely going to create some waves throughout the year, which could have a negative impact on the already tense trading relationship between the US and China. Also, Brexit is not yet resolved, and according to our Global Economic Outlook 2020, across most of the developed economies and Asia, gross-domestic product is expected to grow less in 2020 than in 2019.[6]
Bearing this in mind, generating equity returns from multiple expansion and earnings growth looks to be more difficult to achieve than collecting high-yield coupon payments. So, consider high-yield bonds as an alternative to equities for your portfolio in 2020, for equity-like returns with significantly lower volatility.
Not for Retail distribution: This document is intended exclusively for Professional, Institutional, Qualified or Wholesale Clients / Investors only, as defined by applicable local laws and regulation. Circulation must be restricted accordingly.This document is for informational purposes only and does not constitute investment research or financial analysis relating to transactions in financial instruments as per MIF Directive (2014/65/EU), nor does it constitute on the part of AXA Investment Managers or its affiliated companies an offer to buy or sell any investments, products or services, and should not be considered as solicitation or investment, legal or tax advice, a recommendation for an investment strategy or a personalized recommendation to buy or sell securities.Due to its simplification, this document is partial and opinions, estimates and forecasts herein are subjective and subject to change without notice. There is no guarantee forecasts made will come to pass. Data, figures, declarations, analysis, predictions and other information in this document is provided based on our state of knowledge at the time of creation of this document. Whilst every care is taken, no representation or warranty (including liability towards third parties), express or implied, is made as to the accuracy, reliability or completeness of the information contained herein. Reliance upon information in this material is at the sole discretion of the recipient. This material does not contain sufficient information to support an investment decision.Issued in the UK by AXA Investment Managers UK Limited, which is authorised and regulated by the Financial Conduct Authority in the UK. Registered in England and Wales No: 01431068. Registered Office: 7 Newgate Street, London EC1A 7NX.In other jurisdictions, this document is issued by AXA Investment Managers SA’s affiliates in those countries. |